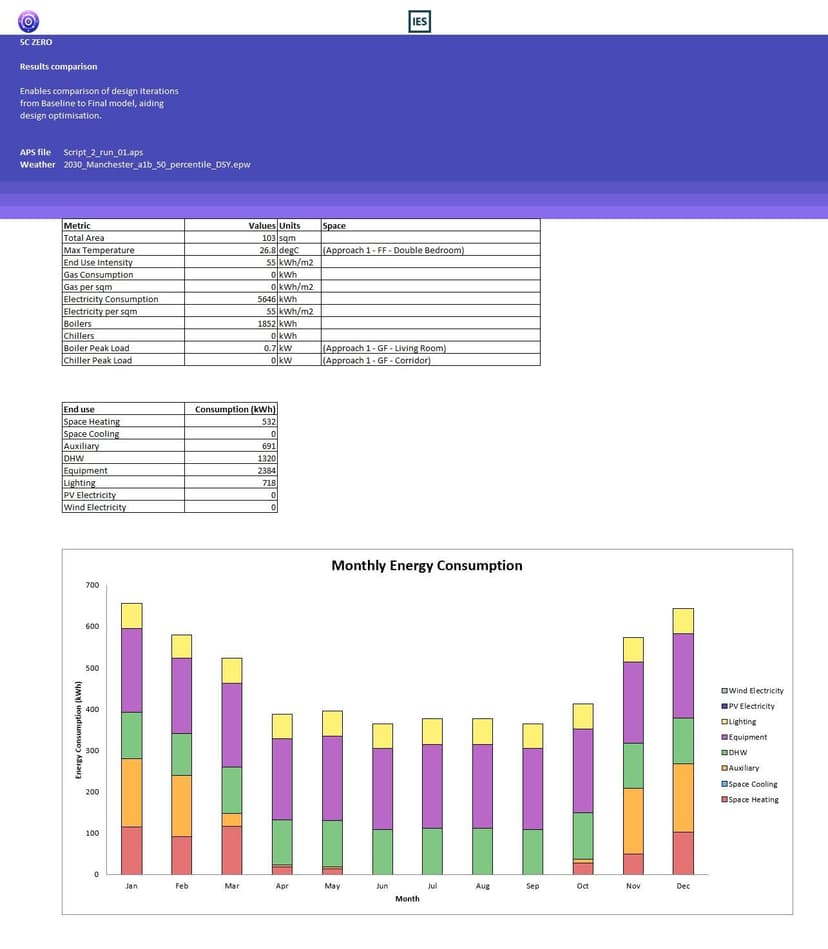
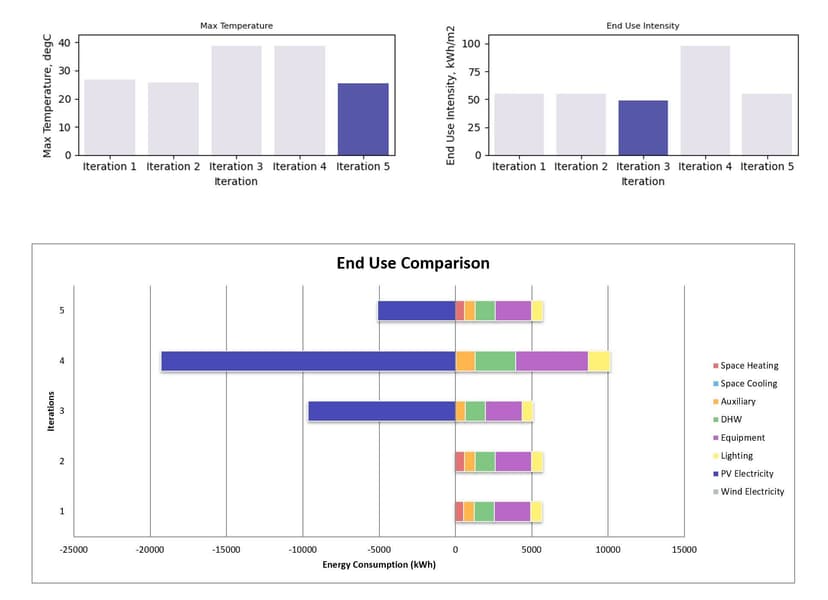
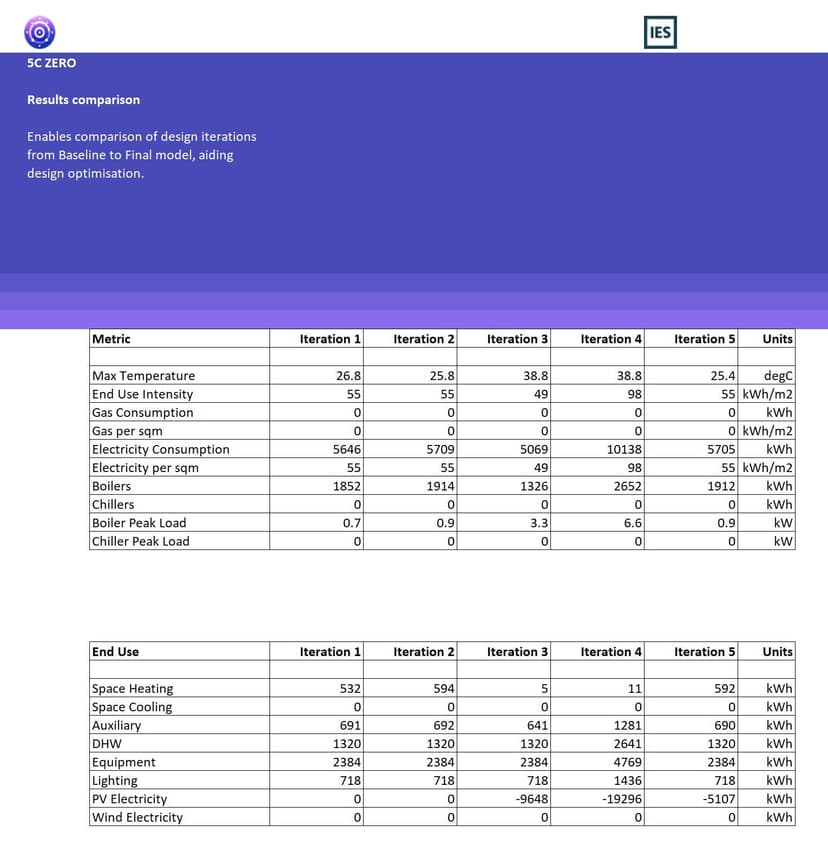


The Energy Use Reporting tool is a VE Python script that analyses and compares energy simulation outputs from up to five IESVE Apache runs. It produces a structured Excel report with performance summaries, end-use graphs, and temperature metrics — designed to support informed decisions and clean reporting during optioneering or QA.
Excel Workbook
Resources

Assess daylight performance for all rooms quickly and accurately, accelerating compliance and improving comfort.
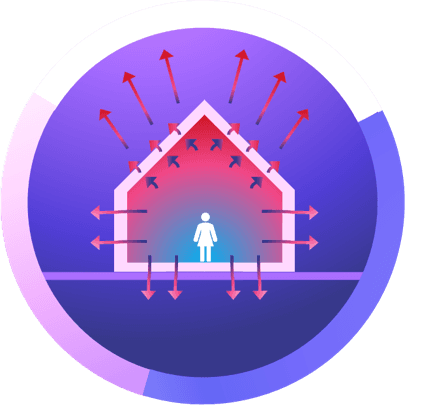
Breaks down heat gains and losses across the model in minutes rather than days, giving you key insights into retrofit priorities and peak loads.
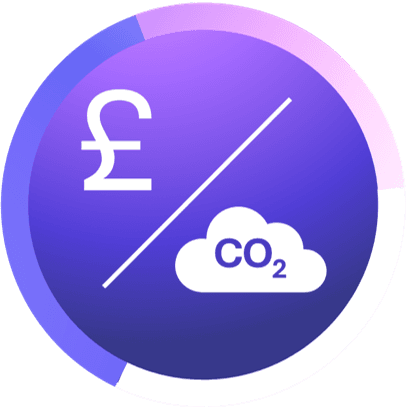
Estimate annual operational carbon and costs, with or without PV and battery, in under a minute—helping you make informed decisions fast.

Cuts the time to extract mechanical data from hours to seconds, enabling faster issue detection and error-free model validation.